Findings from our recent Contact Center Challenges & Priorities survey reveal noticeable movement in current management challenges and the priorities contact centers plan to pursue this year. The only thing certain is change.
I hope you are as excited as I am to dive into the results from our fourth annual survey, with nearly 300 participants sharing their top three challenges and priorities. We maintain our list of options with minor tweaks based on market and industry evolution, as well as past input, so we can look at trends over the years. This year, change is the theme!
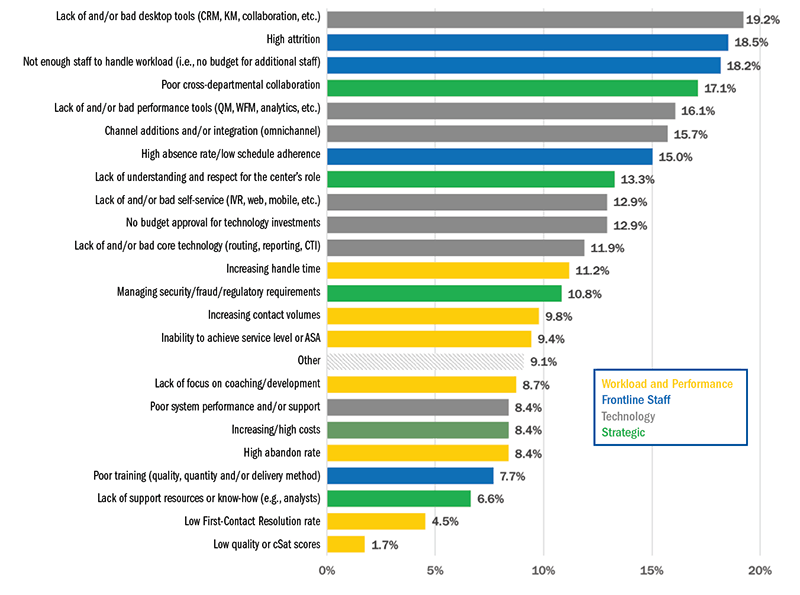
Figures 1 and 2 provide the big picture of how our participants voted. Here is a sneak preview into what we found in these results:
- Attrition was knocked off the No. 1 challenge position for the first time! (It came in a close second.)
- Our new No. 1 challenge is the desktop tools, and they made a BIG MOVE up the chart.
- Coaching and development dropped as a priority, while employee engagement and empowerment moved up significantly and took over the No. 1 spot.
- Technology landed high on the priorities list, taking spots 2-5.
I like that we have some noticeable movement this year. It reflects our dynamic industry in what the vendors are offering, how the labor market is changing, and how centers are maturing. Our results also show the great dilemma centers face: how to deliver great, cost-effective service while being hamstrung by a shortage of tools and staff (and correspondingly, budget limitations). If centers can successfully pursue the priorities, we will continue to see more positive changes. Let’s dive into the results and their implications for your center and the contact center industry.
Figure 1: Biggest challenges
What are your biggest challenges today?
Top Contact Center Challenges
The top half of the challenges is dominated by technology and frontline staff items. The perennial interdepartmental strategic issues have improved but haven’t gone away. Interestingly, workload and performance issues moved down, although a significant number of people noted they don’t have enough staff to handle the workload and many of our “Other” inputs focused on growth.
Desktop tools catapulted up the chart, adding nearly 9 percentage points. About one in five participants now put this problem in their top three, and it undoubtedly ripples into other issues like handle times, training and even attrition. Other technology challenges loom large as well, including performance tools and omnichannel additions and integration. It is interesting that self-service, which shows up near the top of the priorities, is not a top challenge, but prioritizing it can certainly help with the issues reflected in other big challenges (attrition, not enough staff, absence rates, etc.).
Core technology for routing and reporting moved from the back to the middle of the pack. We see that in projects, with many companies sitting on old systems or aching to get something more sophisticated, and perhaps intrigued by the possibilities of a cloud solution.
Moving down the list significantly (roughly 4-5 percentage points) were three items that may be linked: lack of focus on coaching and development, poor training, and lack of support resources. If centers have enough support resources, these other things may improve as well.
Challenges by Industry
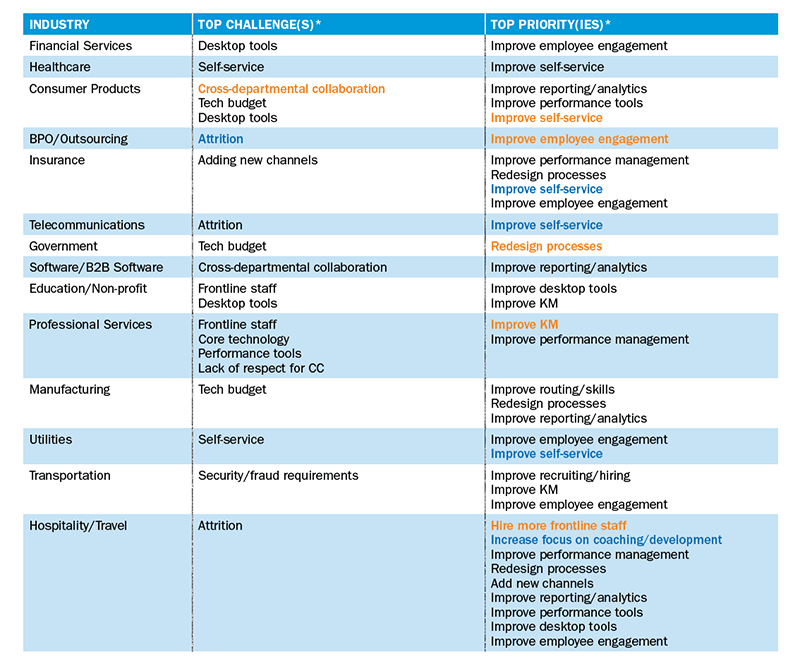
Looking at specific industry input, we find strong ratings (over 20%) on the desktop challenge in eight industries, several of which had over 30% in agreement. Not enough staff was also common, with nine of the 14 industries showing over 20% in voting. While attrition remains a highly rated challenge, its weight was not as universally recognized, with only five industries having 20% or higher. However, the high agreement in a few industries drives up the overall number. BPOs unsurprisingly have strong agreement on their top issues which center on attrition (48%), absence and adherence (43%), and increasing costs (39%). Healthcare participants agreed on the driving challenges of the desktop (31%) and self-service (35%). Other industries had widespread input, with few garnering 30% or higher on any one item.
Table 1 lists the top challenges by industry and the color-coding there reinforces our theme of change. Only BPOs have the consistent top challenge year-over-year (again, not surprisingly). Consumer Products is the only other industry with a repeat winner, only for one year.
Table 1: Industrial Views
Challenges by Size
The top challenges are ubiquitous across sizes, with some interesting standout numbers:
- The desktop tools problem predominates for 100 and fewer seats (20%-30% in each of three size bands), and is not nearly as significant for the larger centers (as low as 9%, up to 15%).
- Attrition is terrible in the mega-centers of 1,000+, with 47% claiming it as a top challenge.
- Bad performance tools are more common in the 100 and under range, less problematic for those above 100.
- Poor cross-departmental collaboration is also a bigger concern on the low end than for centers of 251 seats and up.
Table 2: Size Matters
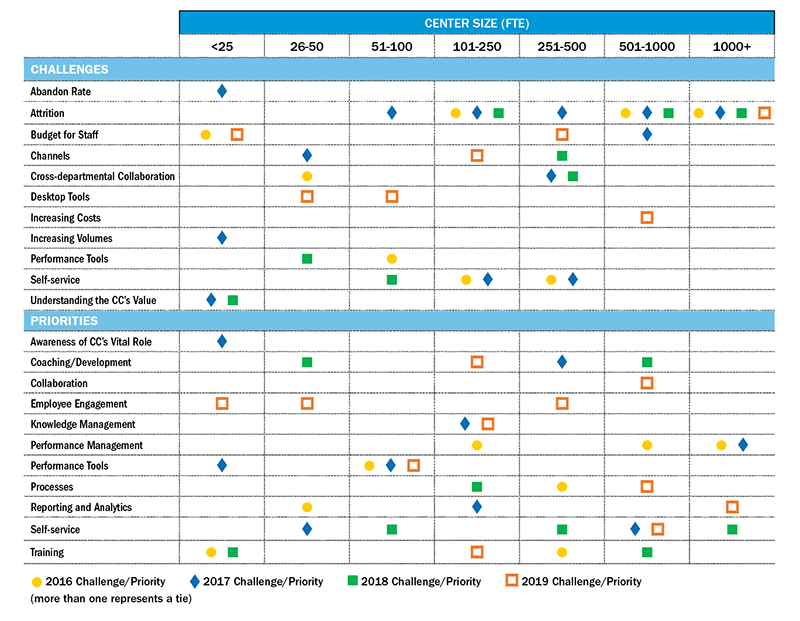
The theme that things are changing is strongly revealed in Table 2, showing the top challenges by size, with the past years included.
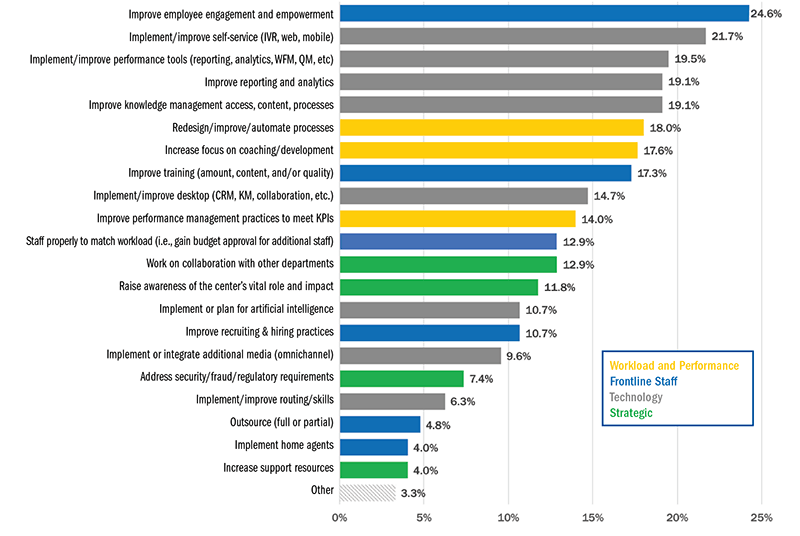
Figure 2: Top Priorities
What are your top priorities to work on in 2019?
Top Contact Center Priorities
Perhaps the most interesting shift in this year’s priorities is the significant downward movement for training and for coaching and development, both now in the 17% range. These are perhaps countered by the great leap up of employee engagement, a “hot topic” that has made it to the top of the list for nearly one in four centers. Some of the other highly rated items, including self-service, performance tools, reporting and analytics, knowledge management and process improvements may help achieve better engagement. They also play a role in tackling the now No. 2 but ever-present challenge of attrition.
As stated in the sneak preview, technology items stole the Nos. 2-5 priority positions. Self-service is a perennial priority, and the variety of channels presents ample opportunities for improvement. The other three stood out for 19% of participants. Clearly there is plenty of work to do in implementing each of these technologies with the right process and people changes, and each can help address some of the high-ranking challenges.
Strategic items continue to rank in the lower half of priorities. Interestingly, workload and performance items are in the top half of priorities, even though they are in the lower half of challenges.
I was interested to see if “Implement or plan for artificial intelligence” would move up the list, given the amount of attention it is receiving in our industry. Our participants perhaps provide a sobering contrast to all the market hype. With just a little movement up, it still ranks in the lower tier or our list.
Priorities by Industry
Looking at the rankings within industries, we find that the top priority (employee engagement) is very consistent. Most of the verticals have over 20% and many over 30%. Healthcare (35%) and BPOs and Telecom (33% each) are the highest. Self-service is high for most verticals, hitting 39% of the Healthcare and Telecom priority lists, and only low for a few such as BPOs, Hospitality/Travel, and Transportation. The other highly rated priorities all have eight or more verticals (out of 14) weighing in with over 20%.
In the past, we’ve had items that garnered 50% or more of the participants in an industry. Not so for 2019. The highest percentages are just below 40%, perhaps reflecting diversity in the challenges even within an industry.
Looking at Table 1 again, we see a bit more consistency in priorities from year to year than we do in challenges. Self-service improvement continues to dominant the goals for insurance, telecommunications and utilities. Five industries repeated their top priority from 2018.
Priorities by Size
Changing our data slicing to size, we again find good consistency among the top priorities, and in fact the greatest alignment on the top two. Five of the seven size bands were over 20% for employee engagement, with only 101-250 under 15% (13%). Self-service captured 20% or higher for all but the smallest centers. Process improvement and KM were also common priorities, with the former receiving more votes from the larger centers (26-34%). The 251-500 range stood out for the greatest consensus on top items, with 41% citing employee engagement and 34% focusing on processes. The large centers (501 and up) homed in on the most priorities, with seven choices garnering over 20% of the participants’ votes.
A few other interesting items: Not surprisingly, AI is a more popular choice for the larger centers, ranging from only 6% for the smallest centers to nearly 23% of the largest. However, the percentage for big centers is down significantly from last year’s 30%. The 251-500 band was again the second highest for AI at 17%, but this is also down (from 21%). Some of the other size bands are up, some down, so I will put AI in the volatile change category! Knowledge management has a stronger showing in the lower end (up to 250 seats). The 1,000+ seat centers stood out with over 25% planning for home agents, which did not even get a vote in the mid-range and only 2-3% in the two smallest bands.
Table 2 shows the diverse and changing priorities by size.
Aligning Challenges and Priorities
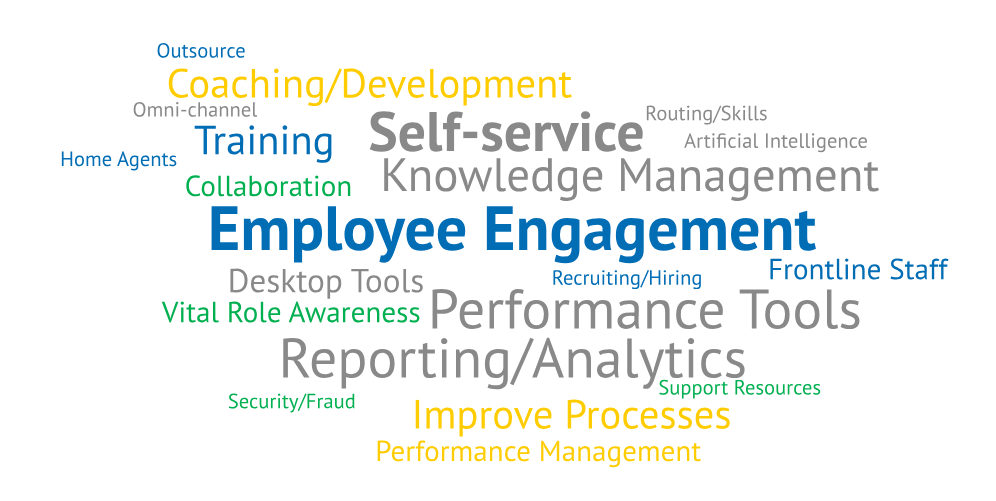
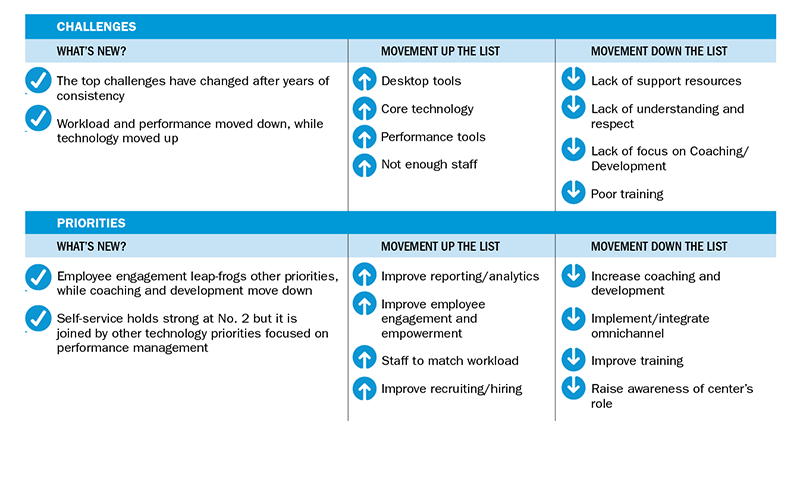
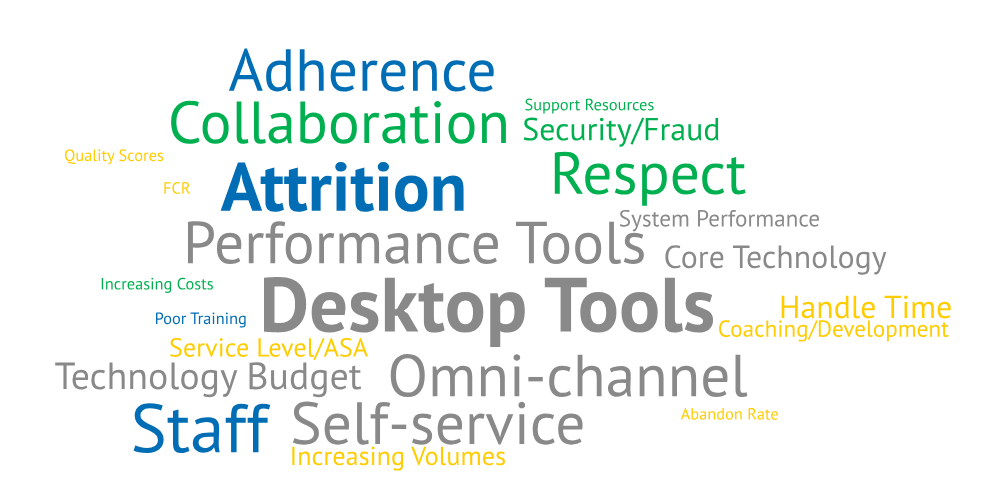
Figure 5 gives a word cloud view of the challenges and priorities, while Table 3 shows our “movers and shakers.” I see pretty good correlation between the issues and the need to prioritize employee engagement. Some of the technology tools that are dominating the priorities have direct cause-effect, like Performance Tools and Reporting/Analytics. Others, like Self-service and Desktop Tools, lack a direct line between challenges and priorities. Self-service as a high priority can tackle some of the other top challenges. If desktop tools are such an issue for so many (as we’ve seen in project work), it may be important to bump it up the priority list. The focus on knowledge management and process improvement is a good start.
While we’ve seen improvement in the strategic elements of collaboration and respect, the disconnect we’ve observed in pushing those down the priority list remains. My commentary of the past holds as centers continue to do triage and tackle what they can, although I’m encouraged at the improvements in this category.
A final note is one that emphasizes our theme of change. In the past, we have seen consistency in some of the survey’s messages, while this year shows some significant deviation. The alignment is one of the things that stands out. The movement up and down the list aligns. I’ve changed the notes in Table 3 from “Similarities” with the past, to “What’s new,” because this year is different.
Table 3: Movers and Shakers
Here are the interesting comparisons we see in the results from our 2019 survey compared to 2018. This table also reflects some aligned movement of challenges and priorities.
Survey Participant Demographics
Contact center leaders consistently weigh in as the majority of participants (55%), followed by support analysts (9%), supervisors (7%), corporate executives (7%), IT (6%), consultants (6%), sales and marketing (4%), and “others.” Figures 3 and 4 show the variety of industries and distribution of center sizes. We have strong financial services participation, and a few other industries have good representation, as well. The sizes are well distributed and may nicely reflect the market—many small centers (50 and under), not tons of large centers (over 500). We analyze the data by verticals and size so you can see targeted results in addition to the big picture.
Figure 3: Industries Represented
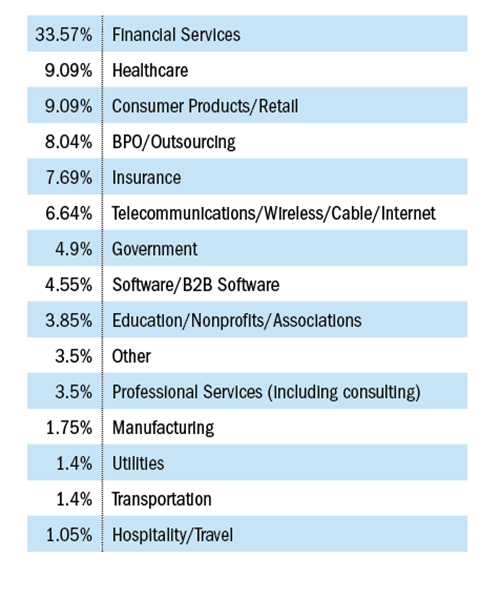
Figure 4: Survey Participant Size Distribution
How many FTE contact center seats does your organization support across all sites?
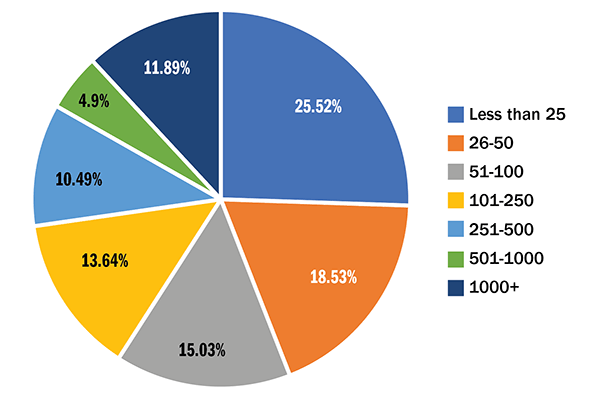
Figure 5: Alignment of challenges and priorities
Challenges
Priorities
