


The Voice of the Customer (VOC) process is strategically critical because it reduces preventable problems and improves products and their delivery. Every dollar invested in a well-designed VOC program typically returns 10–20 times the ROI of the same dollar invested in direct customer service.
This is Part 1 of a two-part article. Part 1 focuses on the structural foundations of a high-impact VOC program. Part 2 examines execution: reporting, action planning, accountability, tracking, and practical low-cost enhancements.
Background, Objectives, and Method
In 2019, Contact Center Pipeline partnered with Customer Care Measurement & Consulting (CCMC) to survey its reader base on performance across key VOC activities.
These activities included unified management, data collection planning and execution, analysis, and reporting, and then taking action, communicating priorities, and measuring outcomes.
VOC success was defined as a significant year-over-year (YoY) increase in customer satisfaction and a high percentage of VOC-identified issues resolved in a timely manner.
In 2026, we, also with Contact Center Pipeline, prepared the 2026 VOC Impact study, which broadened the sample to include companies known to be innovators.
While the total sample was smaller than in 2019, CCMC identified eight companies with strong VOC impact, evidenced by sustained YoY satisfaction gains and a high rate of issues fixed through VOC.
The commonalities across these companies are shared below, along with specific examples from three organizations — Michelin, Nestlé Purina, and Travelzoo — which operate high-performing VOC processes and agreed to be identified by name.
The Basics Are the Same—But Complexity is Greater
The 2026 results reinforce the findings of the 2019 study. Critically, with the advent of new technologies, they also suggest a restructuring of the factors that support the design and implementation of the technical architecture of VOC applications.
These applications now automate large portions of VOC collection, analysis, reporting, and implementation monitoring. However, they do not deliver meaningful results and insights without careful management and monitoring by both savvy quality and product management leaders; these tools are NOT fire-and-forget.
Mindless deployment risks repeating what has already happened with blanket post-interaction surveying of every customer touchpoint: wasted resources, customer alienation, and inactionable output.
Figure 1 shows the six basic factors that map to the VOC data journey from collection to reporting, impact, and evaluation.
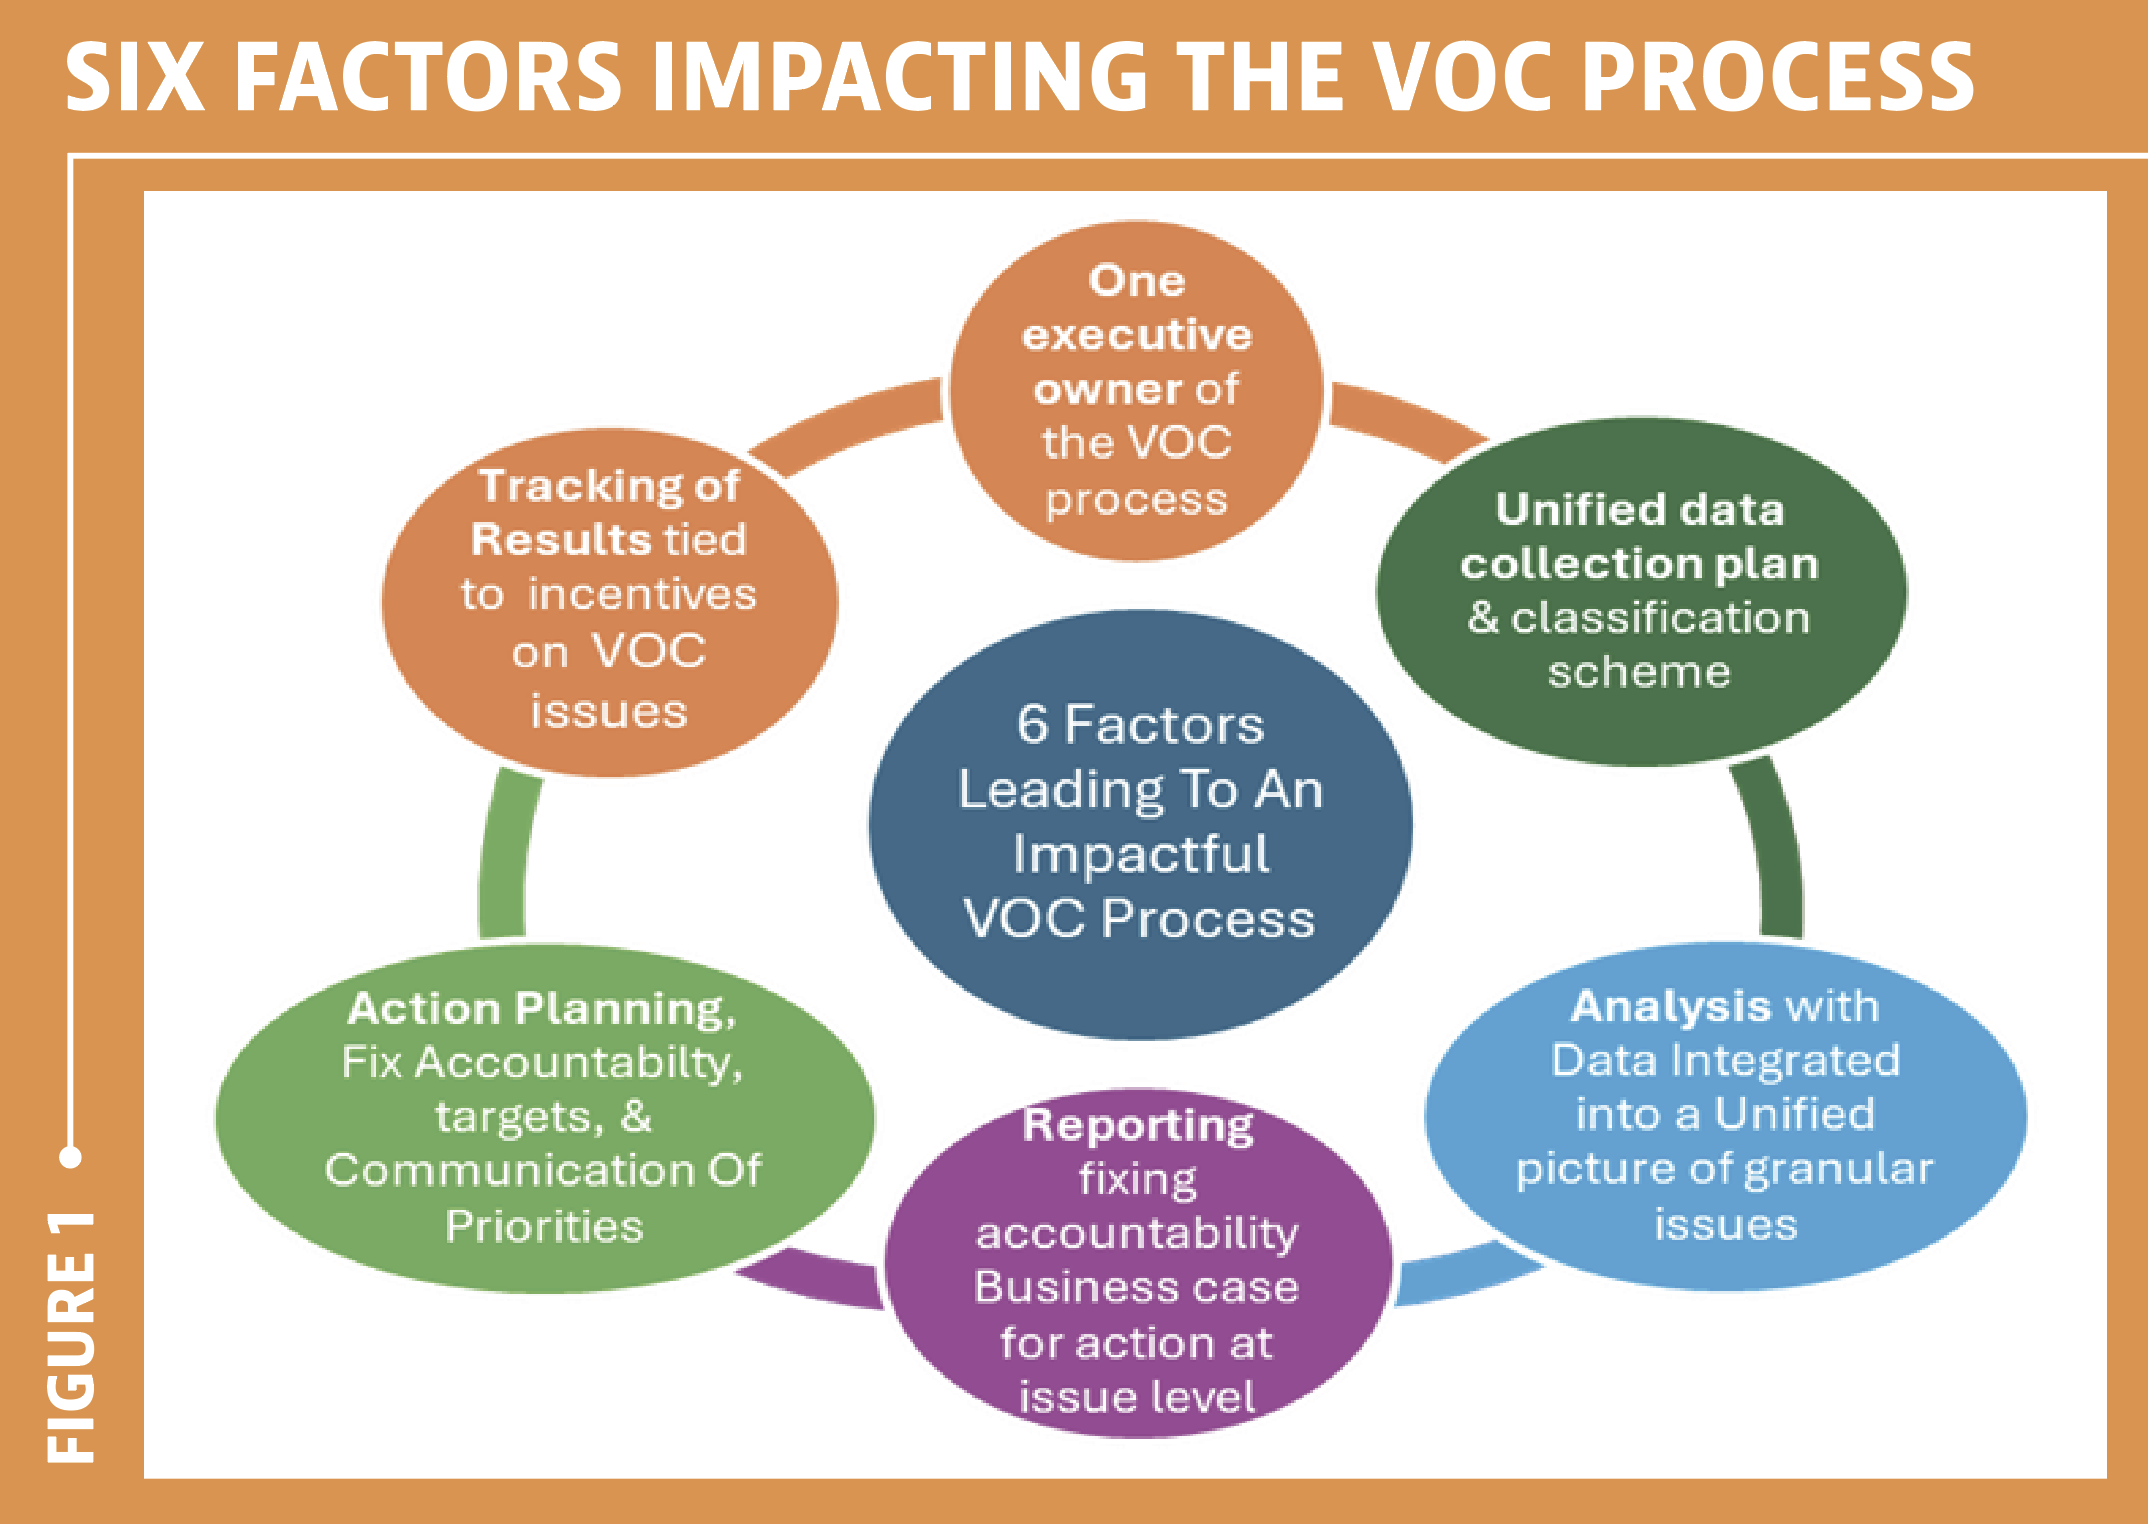
The six factors include one governance factor — single executive ownership — and five process factors that span the journey from data collection planning to reporting and impact measurement.
Here, in this first article, we will focus on the first three: governance, unified data collection, and AI-enabled analysis, with the others covered in Part 2.
Three Design Choices That Build VOC Capability
As noted earlier, eight respondent companies indicated strong YoY increases in satisfaction. Their reporting forms the basis for the following updated dimensions of a best-in-class VOC process.
1. One Executive in Charge of VOC Is Critical
There is still no single ideal functional home for the VOC executive. However, one executive must be clearly in charge and accountable.
Because VOC inherently surfaces “bad news” and then points to the function best positioned to address the issue, accountability for performance, accompanied by explicit executive support, is essential.
Diluted leadership in this area leads to handwringing and very little impact. Conversely, a strong leader can portray customer dissatisfiers as trapped revenue and profit that can be captured rather than surrendered.
Mindless deployment risks repeating what has already happened with blanket post-interaction surveying of every customer touchpoint…
The VOC executive should prepare management for bad news and reframe it as escaping profit that can be recaptured. See “Researchers: Bad news is inevitable, so set expectations,” Quirk’s Media.
The key to success seems to be less the executive’s home function than the executive’s reach across other functions to gain access to broader data sources and analytical input.
Further, this executive should be responsible for reporting on how well all critical functions — Product Management, IT, Quality, and Marketing — work together to identify and resolve the most important points of pain and the strategies that cause them.
2. A Unified Data Collection Plan Has Grown in Complexity
This complexity is driven in several ways, including the use of AI and the capture of instances and causes of escalation. At the same time, two enduring challenges still run across the customer journey: consistent coding of issues and reliable customer identification.
Innovations and best practices in this area include:
A. Consistent classification schemes across all functions
Different modes of naming issues impede the ability to integrate data. Several companies use AI to collect data from multiple sources and rationalize it into common pools with consistent descriptions of customer issues, whether from consumers (via complaints or social posts), dealers, or warranty data.
B. AI for coding and sentiment
AI can be used for coding and sentiment analysis of voice, chat, email, and social posts. Michelin scans social media sources for comments and issues, as well as review sites and social media influencers, regardless of location. Meanwhile, Nestlé/ Purina monitors and responds to all its own social properties.
“We found that stories and descriptions posted by influencers in one geography can have significant impact on consumer expectations in completely different geos where the marketplace is very different,” says Joe Mazure, Director of Consumer Care for North America, Michelin.
“Each geography cannot assume it is operating separately, at least in the social media world.”
C. AI to identify sources of new customers
AI is increasingly able to ascertain the source of new customers, including the ability to identify and track customers acquired via positive word-of-mouth/mouse (WOM/M).
With the advent of social media, and the ratings/reviews on this channel as primary methods of shopping and customer education, the ability to assess these impacts at the individual customer level as well as at the market segment level, is critical.
AI can review disparate data sources about each customer to tease out correlations for small segments that would be impossible to find using traditional research methods.
In many markets, including all three of the leaders mentioned here, WOM/M impacts can actually be larger than the direct impact of problems on customer loyalty.
D. Customer and employee advisory boards
Establishing customer and employee advisory boards results in both groups proactively noticing opportunities and contributing more actively because they know their comments will have impact.
Michelin and Travelzoo have quarterly employee input sessions, while Nestlé Purina maintains an open channel for contact center employees, beyond simply telling their supervisors.
E. Feedback on the impact of feedback
Showing what was done with feedback dramatically increases future feedback and builds trust that contact center employees can convey to consumers.
CCMC’s 2025 National Rage Study found that the desire to be heard is almost as important as having the problem resolved. If CSRs assure the consumer that their input will be heard, this significantly enhances satisfaction with the contact.
F. Tracking and proactively offering escalation
Leading companies track complaint escalations and sometimes use AI to identify situations in which proactive escalation should be offered.
Showing what was done with feedback dramatically increases future feedback and builds trust…
Lisa Oswald, Global Head of Member Services, Travelzoo, reports, “Our front-line reps code reasons for escalations to identify what was missing that led to the appeal, such as a confusing deal page, lack of information, loss of value, or a broken process.
“Further, we view 100% of negative surveys as escalations and review all, as they provide information on why the root-cause issue was not resolved when first encountered.”
3. Analysis and Data Integration Have Become Supercharged
Analysis and data integration have become supercharged by AI and by the addition of part-time analysts from other functional departments.
The expected actionability of the output has also increased. VOC users now say, “Don’t just tell me there is a problem. Identify the cost, the root cause, and suggest mitigating actions.”
A. Cross-functional participation in analysis
All of the leading companies include representatives from Product Management and Marketing in the analysis process, and most also include Quality and Performance Improvement personnel.
At Travelzoo, there is a liaison with IT who is resident in the Member Services Department and understands the complete IT product-development environment. This person helps ensure that customer-identified problems are fixed, the analysis is valid, and the recommendations are realistic.
B. AI-enabled integration of diverse data
AI is being used to integrate available data into a single, unified picture of market reality. Integrated data include:
• Communications and text analysis
• Surveys
• Postings by consumers, communities, review sites, and influencers
• Operational data, such as website interactions and production and supply chain changes that affect product and service availability and characteristics.
• Website search records (both successful and unsuccessful)
• Transaction failures
These last three categories of operational parameters are called the “Voice of the Data” by Bill Price, CEO of Intendra and author of The Best Service Is No Service.
C. Use of multipliers
Companies use multipliers—the ratio of complaints to problems found in the marketplace, usually 1:8 to 1:15 – to extrapolate complaint data to the market level.
These ratios surprisingly apply to business-to-business (B2B) environments as well; business clients behave like consumers and often don’t complain.
This analysis allows complaint data to be combined with survey, warranty, and internal quality-inspection data.
Further, the loyalty and WOM/M damage associated with complaints and unarticulated problems can be layered onto those other sources to estimate the overall revenue and WOM/M losses of each issue or point of pain.
Revenue analysis increasingly includes the negative effect of lost customers and the positive effect of new customers acquired…
Nestlé Purina has introduced this analysis to quality and product managers to strengthen the impact of VOC analysis.
Terri DeMent, Director of Consumer Service, Nestlé Purina, reports, “Quality, Product Management, and Finance have all been receptive to using the complaint multiplier concept (e.g., for each complaint received, there are eight other cases in the marketplace).
“This helps to make stronger business cases because it demonstrates that more consumers are actually encountering the issue than only those who have complained to us.”
D. AI on free text to find hidden associations
AI is being applied to free text to identify previously unknown associations and market segments. Examples include:
• Identifying which customer onboarding method is most successful at setting expectations for technology products, thereby preventing subsequent problems and churn.
• Linking higher turnover in rentals among single female apartment dwellers to a prior history of complaints about poor parking-lot lighting.
Both connections would have been difficult to identify without AI analysis across a wide range of data.
E. Inclusion of WOM/M impacts in revenue analysis
Revenue analysis increasingly includes the negative effect of lost customers and the positive effect of new customers acquired via delight stories.
In some environments, customers acquired through positive WOM/M are assigned a higher value because they tend to be less price-sensitive.
Robust positive WOM/M also drives customer acquisition at much lower cost than traditional tools such as advertising and promotions. The most successful companies acquire as many as 70% of their new customers via WOM/M at extremely low cost. Further, as noted above, such customers are less price sensitive.
F. Translating impact into revenue
Output now includes the number of customers affected by each issue; in most cases, that number is converted into revenue implications using an extended customer value.
Many companies are moving away from traditional customer lifetime value (CLV) because Finance is often skeptical of very long-term estimates. Many now use a maximum of three years of revenue.
G. Revenue-based prioritization
In most leading companies, including Travelzoo, Michelin, and Nestlé Purina, the CX analysis group identifies priority issues based on business impacts and/or the number of customers affected.
Sometimes employee input and impacts are also included, as 30% of customer points of pain (POP) are also employee POP.
What Comes Next in Part 2
Part 1 has focused on the structural choices that make VOC credible and analytically useful: executive ownership, unified data collection, and stronger analysis. Part 2 turns to execution: how leading companies report VOC insight, assign accountability, track results, and avoid the blind spots that weaken ROI.
This article appears in October 2026.

