

Consider these increasingly common occurrences throughout contact centers:
• An AI assistant reads your knowledge base on a customer’s behalf, answers them, and never opens a ticket. Your deflection rate improves.
• An agent-shaped bot fills in your web form. Your speed-to-lead starts timing how fast you called a robot back.
Neither event involved a person. Both were counted. And somewhere a budget or a headcount plan rides on the count.
How AI Distorts Metrics
That is the whole problem, and it reaches further into your reporting than most people expect.
• Your cost per contact improves when contact volume rises. If a share of that volume is AI bot software rather than customers, the number gets better while the cost of serving an actual person gets worse. You will carry that improving number into a budget meeting and defend it.
• Your chatbot containment counts a session that ended without escalation. An AI summarizer walking your chat flow ends exactly the way a satisfied customer does.
• Your first contact resolution (FCR) assumes there was a first contact. The moment that contact was a script, the metric is describing something that did not happen.
None of these counters are broken; each of them is doing precisely what it was built to do. But what happened is that the population – AI bots versus people – underneath them changed.
I can prove that in one channel, and reason about the rest. Here is the worked example, and what it means for the numbers you own.
My Experience with AI Skewing Outcomes
I am co-founder and CTO of a nearshore call center company and I build our AI quality systems. This started with an afternoon I had not planned to spend on it. I was checking that a page of our own research was being found, so I opened our web search report and sorted it by volume.
It did not look like people.
The largest single query on the property was a seven-word sentence: “belize healthcare outsourcing hipaa phipa alignment 2026.” Below it sat near-identical sentences with the same clinical phrasing and year stamp, differing by a word or two.
The moment that contact was a script, the metric is describing something that did not happen.
The top four queries had between roughly 2,200 and 5,500 impressions each. The click column read zero all the way down.
Here’s what really tipped me off that something was wrong. Nobody types the same seven-word sentence 5,000 times in a month.
Machine and bot traffic alone would not have been worth an afternoon; every website collects some. What bothered me was the shape. Real human demand has one: a head of short queries, a long thin tail, and clicks that roughly track position. This had none of it.
I used web search for the proof because of what it hands back to you. Most channels give you an event and nothing else: a session opened but a ticket did not appear. Web search gives you the exact string the visitor typed, which means you can sort the two populations apart instead of guessing at them.
So, I did what an engineer does with a dataset that offends him. I exported it and wrote code to take it apart.
The Split, Run Twice
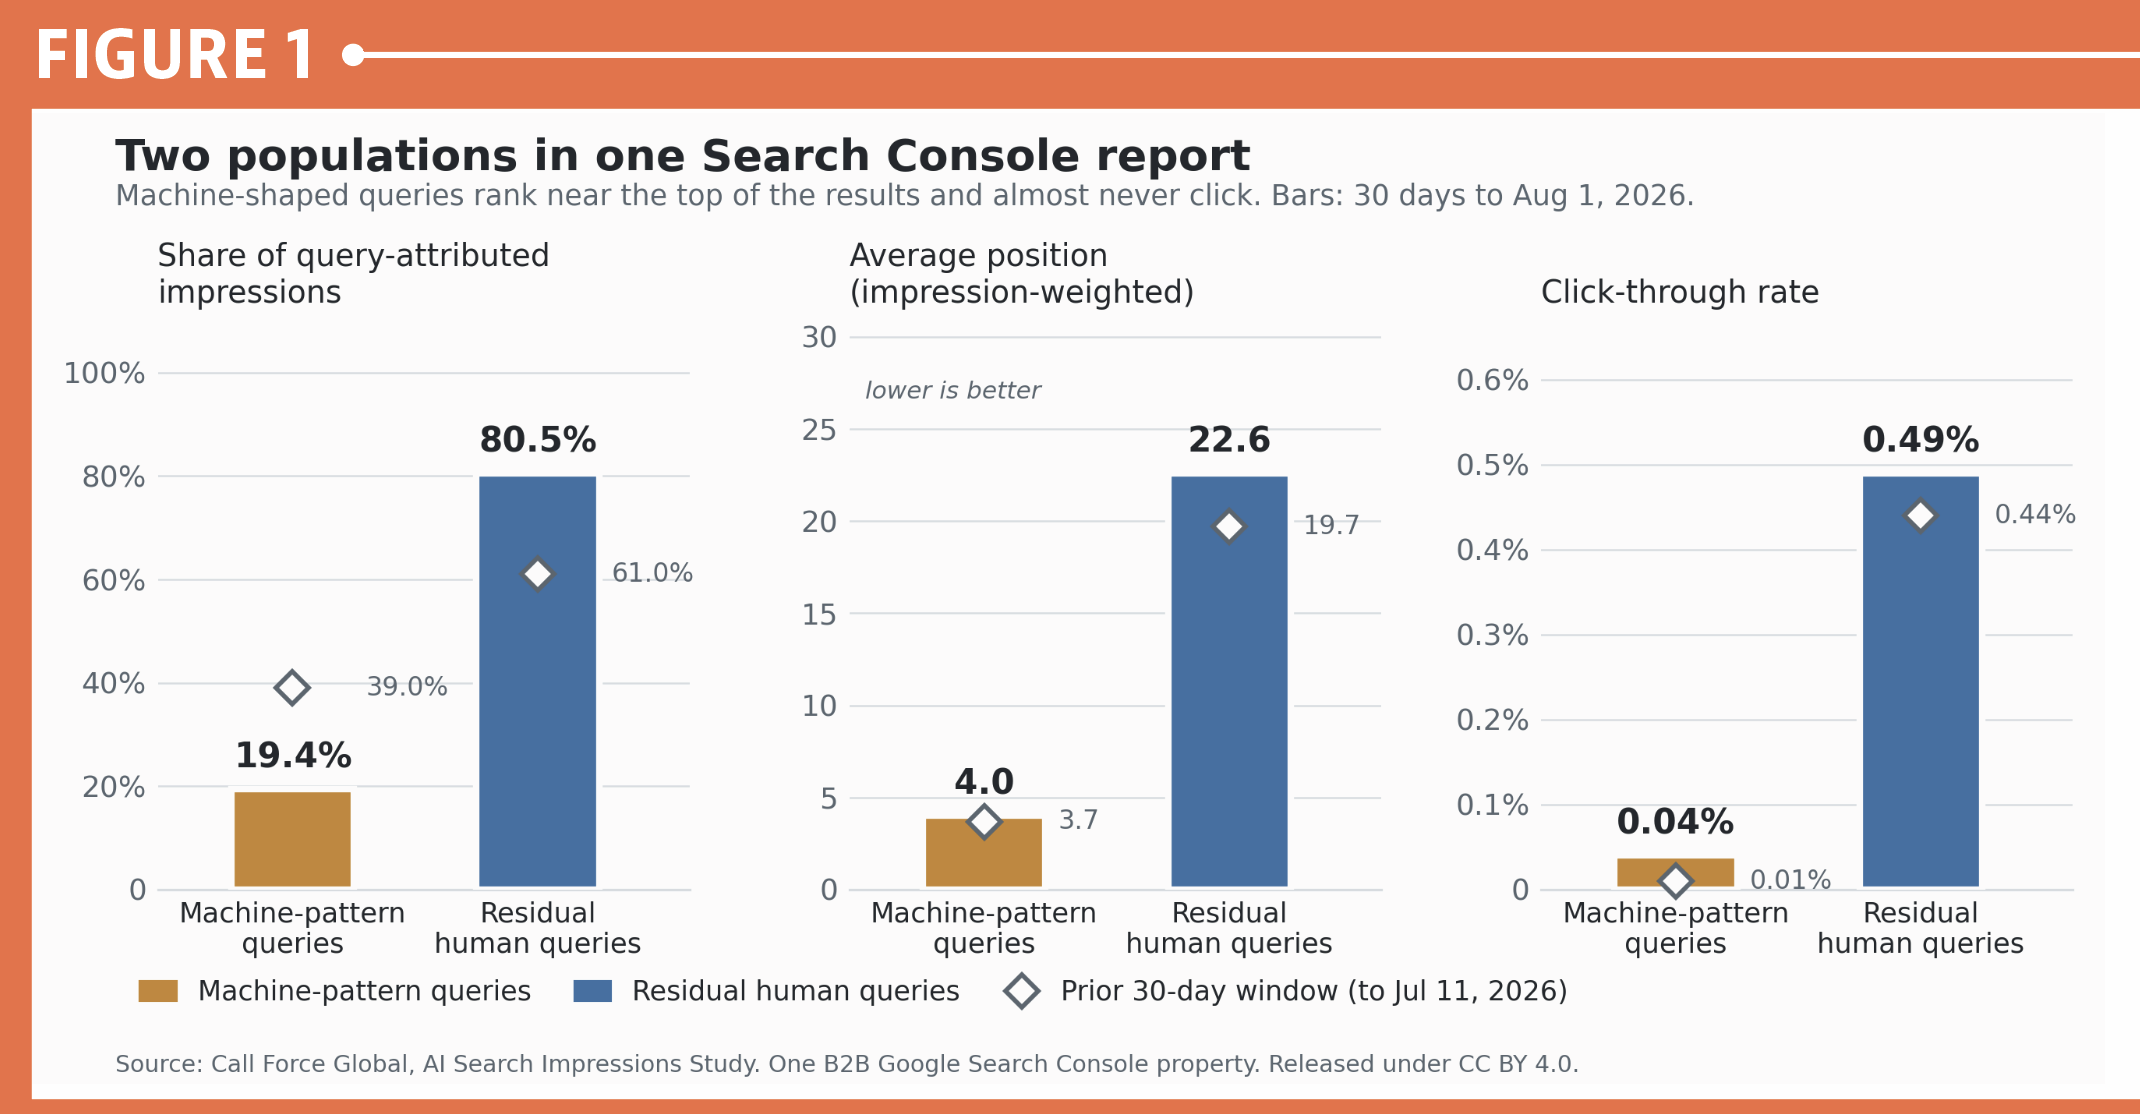
For the 30 days to July 11, 2026, strings that no person types accounted for 39% of the impressions that carried a visible query string, which is the only portion anyone can classify.
Then I reran the same code against the 30 days to August 1. It came back at 19.45%.
Same property, nothing changed on my side, and the share halved.
FIGURE 1 shows the two windows side by side, and the two populations sit apart on every measure that matters. Machine and bot queries averaged position 4.0 in the current window against 22.6 for the humans, and clicked at 0.04% against 0.49%.
Blend them, as every standard report does, and the property reports a 0.41% click-through rate. In the earlier window the blended figure was 0.27% against 0.44% for humans alone.
Every input is real. But the output is fiction.
That volatility is why I will not hand you a correction factor, meaning a fixed multiplier you apply to a contaminated number to estimate the clean one.
Divide human-only by blended and mine was roughly 1.6 in July and roughly 1.2 six weeks later. Anyone selling you a fixed adjustment for bot traffic is selling a number with an expiry date.
Where The Junk Sits
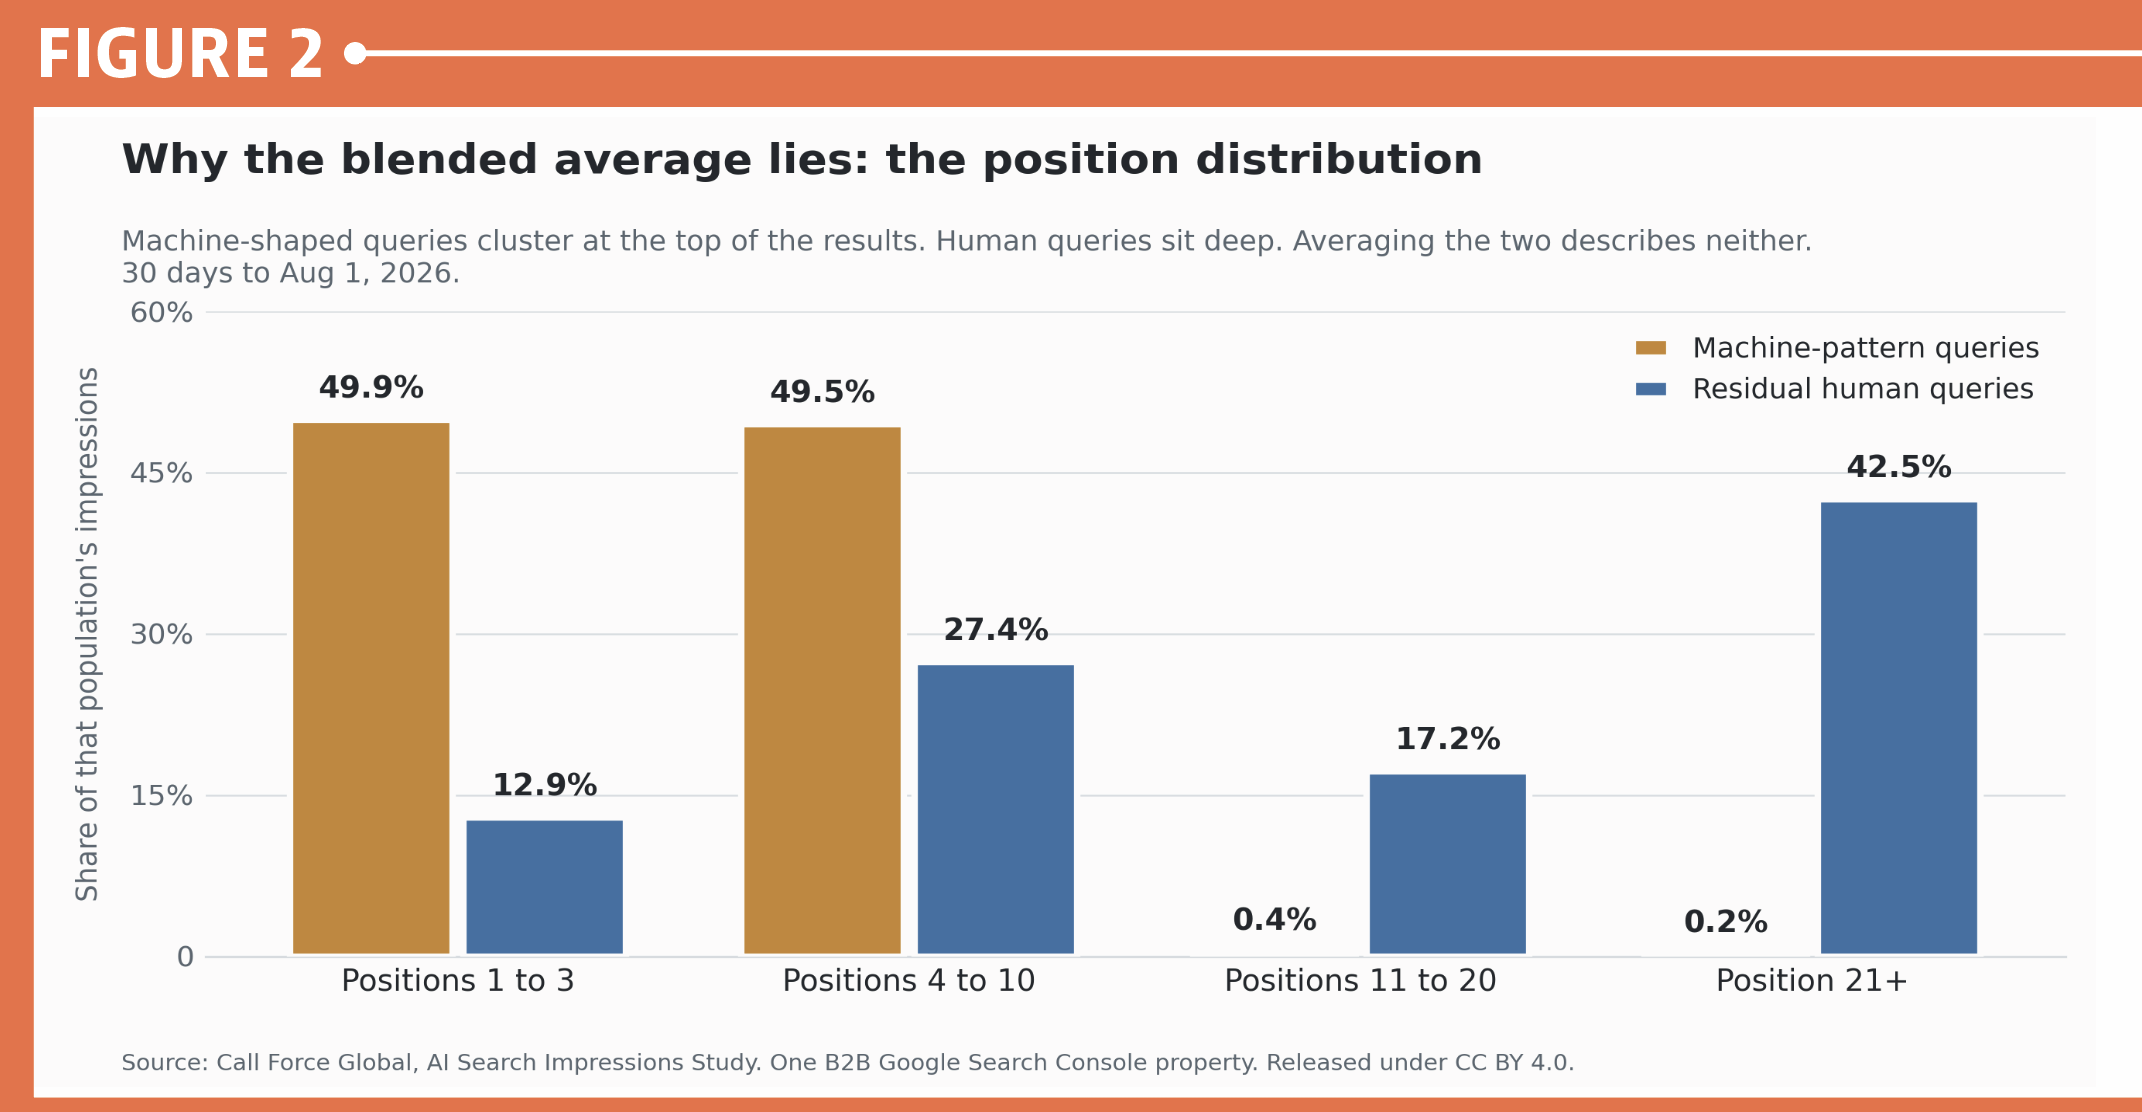
I expected the machine and bot traffic to sit deep in the results where nobody looks. It does the opposite and FIGURE 2 is the picture of it.
Half of all machine and bot impressions, 49.9%, landed in the top three positions. Only 12.9% of human impressions did. The humans pile up at the bottom instead: 42.5% of them at position 21 or worse.
Contamination does not spread evenly across a report. It pools where the numbers look best, which means click-through rate falls hardest on the pages you would point to as proof things are working.
My first instinct was to rewrite the titles on those pages. They were never broken. Nothing was reading them. So they weren’t responsible for the junk. The impressions came from software that almost never clicks, no matter what the titles said.
The Same Failure, One Funnel Over
I recognized that pattern because I live with its twin, much closer to the floor.
We score every call with an AI model and route the flagged ones to a human reviewer. A quality score rolled up across a book of calls, meaning one average standing in for hundreds of individual scores, is a blend.
If the automated layer behaves differently on one campaign than another, the average stays green while the campaign moves, and the natural response is to coach agents whose calls were never the problem.
Same failure, different channel: a number built by averaging across a population that turned out to be two.
Where Reasoning Is Needed
This is the point where measurement stops and reasoning begins, and I want to be clear about which side of it I am on.
In web search, I can prove the split because I have the string. In your contact center, you usually cannot because the channel hands you the event and keeps the fingerprint.
Contamination does not spread evenly across a report. It pools where the numbers look best, which means click-through rate falls hardest on the pages you would point to as proof things are working.
Email opens are the one case I have observed directly. An open is recorded when a tracking pixel loads, and plenty of what loads pixels is not a recipient. Corporate security gateways open links to sandbox them and add a second layer on top.
The rest is inference, labeled as such. Deflection, containment, self-service success, and speed-to-lead all count a physical event that software can now manufacture. I have not measured those on a contact center stack. What I have measured is the mechanism they share.
What Metrics Survive
Now the reassuring part, which turns out to be most of your reporting pack.
Anything that ends in a human confirmation step still means what it says, because a person had to be present – an agent or a customer – for the metrics to move.
• Average handle time (AHT) holds up because a human handled the calls.
• Service levels and average speed of answer on answered calls continue to be valid because somebody stayed on the line long enough to be answered.
• CSAT, NPS, and customer effort score survive because customers chose to respond.
• Quality scores on human-reviewed calls survive for the same reason, which is exactly why we route flagged calls to a person instead of letting the model close them out.
The exposed ones are the metrics that count an event no human needs to be present for:
• Deflection rate
• Chatbot containment
• Self-service success
• Speed-to-lead
• Cost per contact because the denominator is contacts.
• FCR, when the first contact was a script.
Occupancy sits awkwardly between the two. Your agents were genuinely busy, and the number is honest about that. But busy is not the same as productive if some of the work arrived from sessions no customer needed.
Anything that ends in a human confirmation step still means what it says, because a person had to be present – an agent or a customer – for the metrics to move.
The voice floor is largely trustworthy. Digital and self-service reporting is where to look first. If a metric can move without a person doing anything, treat it as an estimate rather than a count.
Five Questions for Your Analytics Team
None of this requires you to touch a data export. Where a channel produces something you can read, a query string or a chat transcript, ask for 50 examples and read them yourself. You will know within a minute.
Then ask your analytics team these five questions:
1. What physical event increments this number? An open is a pixel load. A deflection is a ticket that never appeared.
2. Can software generate that event? If yes, the count blends two populations.
3. Can we split the population before we average, rather than correcting afterward?
4. What does the human-only figure look like next to the blended one? The gap is itself a diagnostic, and it moves.
5. Which of our metrics end in a human confirmation step? Those you can keep trusting.
The Honest Caveat
This is one property, over 30 days, twice. A business services website with small click volume in absolute terms. I will not dress it up as a market study.
The narrower claim I will defend: on this property, in both windows, the two populations were distinguishable from the query string alone; they behaved in opposite directions on rank and on clicks, and averaging them produced a figure that described neither one.
Whether the same is true of your channels is an empirical question, and it has a cheap answer. Given what we found, I would encourage you to look.
The dataset, the classification patterns, and the reproduction script are published under CC BY 4.0 through our site. Point the script at your own data and get your own number instead of borrowing mine.
This article appears in October 2026.
